Appearance
View service status
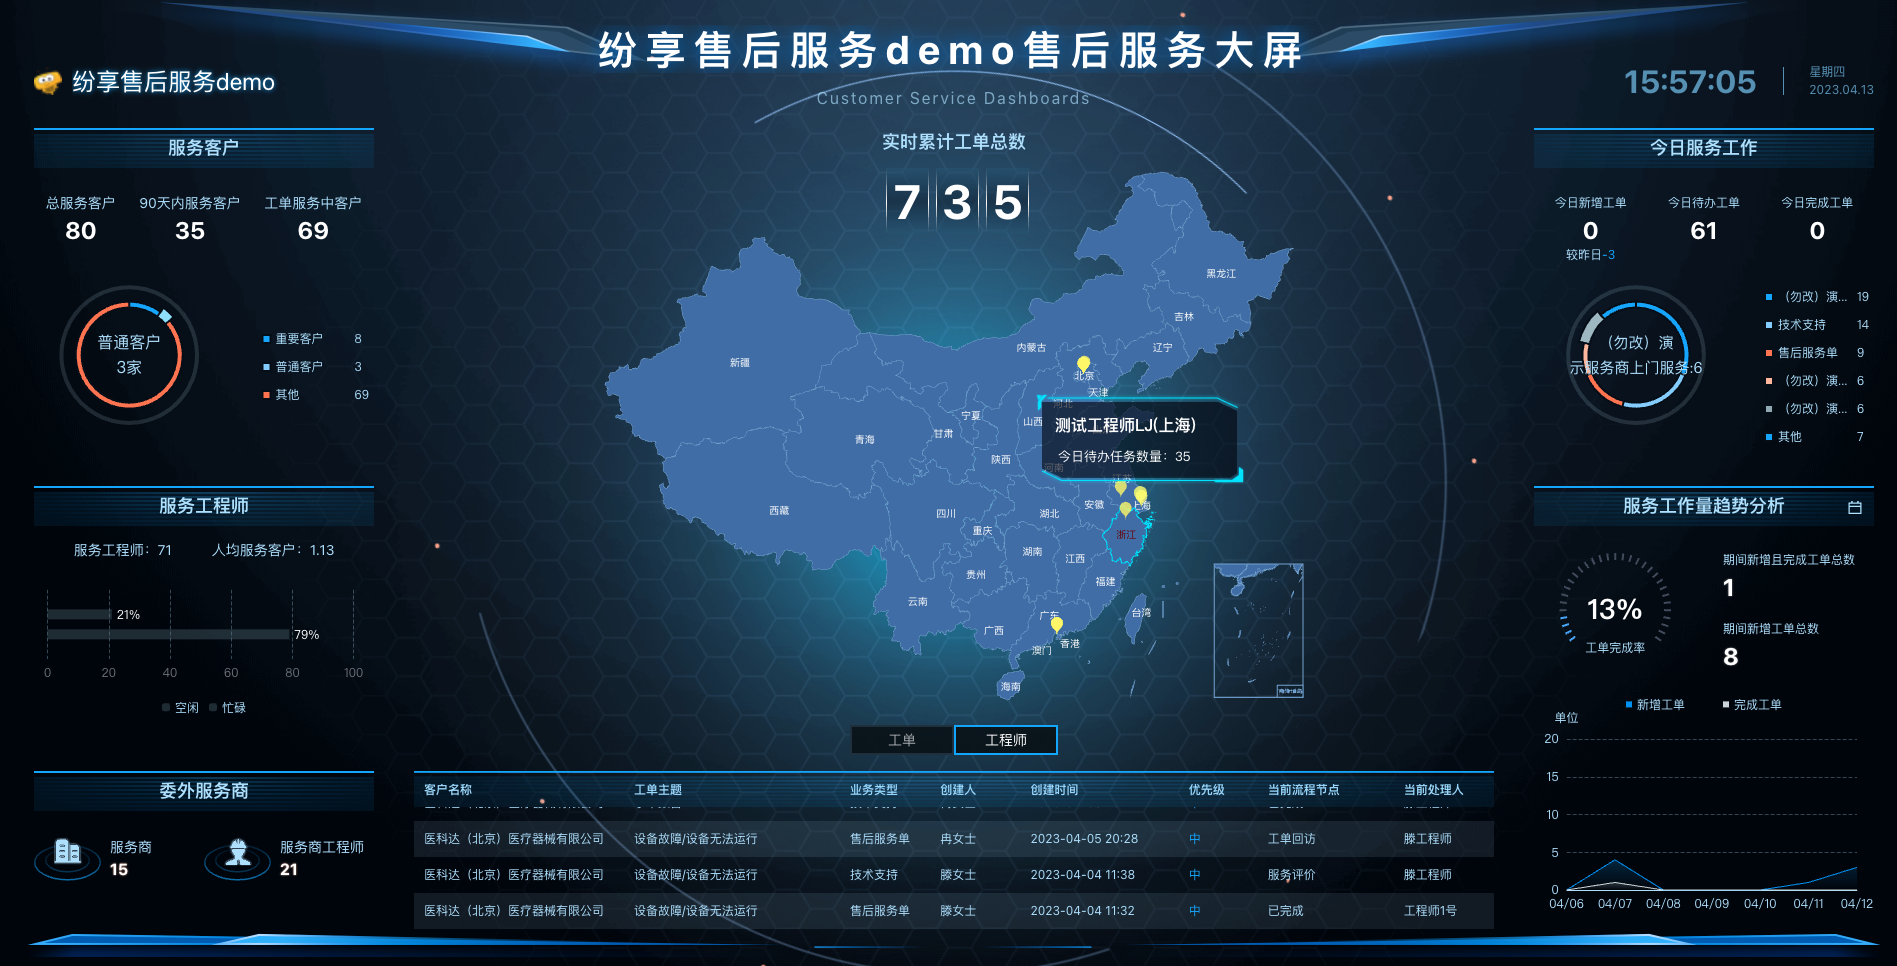
View operational data such as customers, service resources, today's work orders, trends, and latest work orders.
Overview
The service status overview uses map and dashboard components to display the service running status.
Before you begin
IMPORTANT
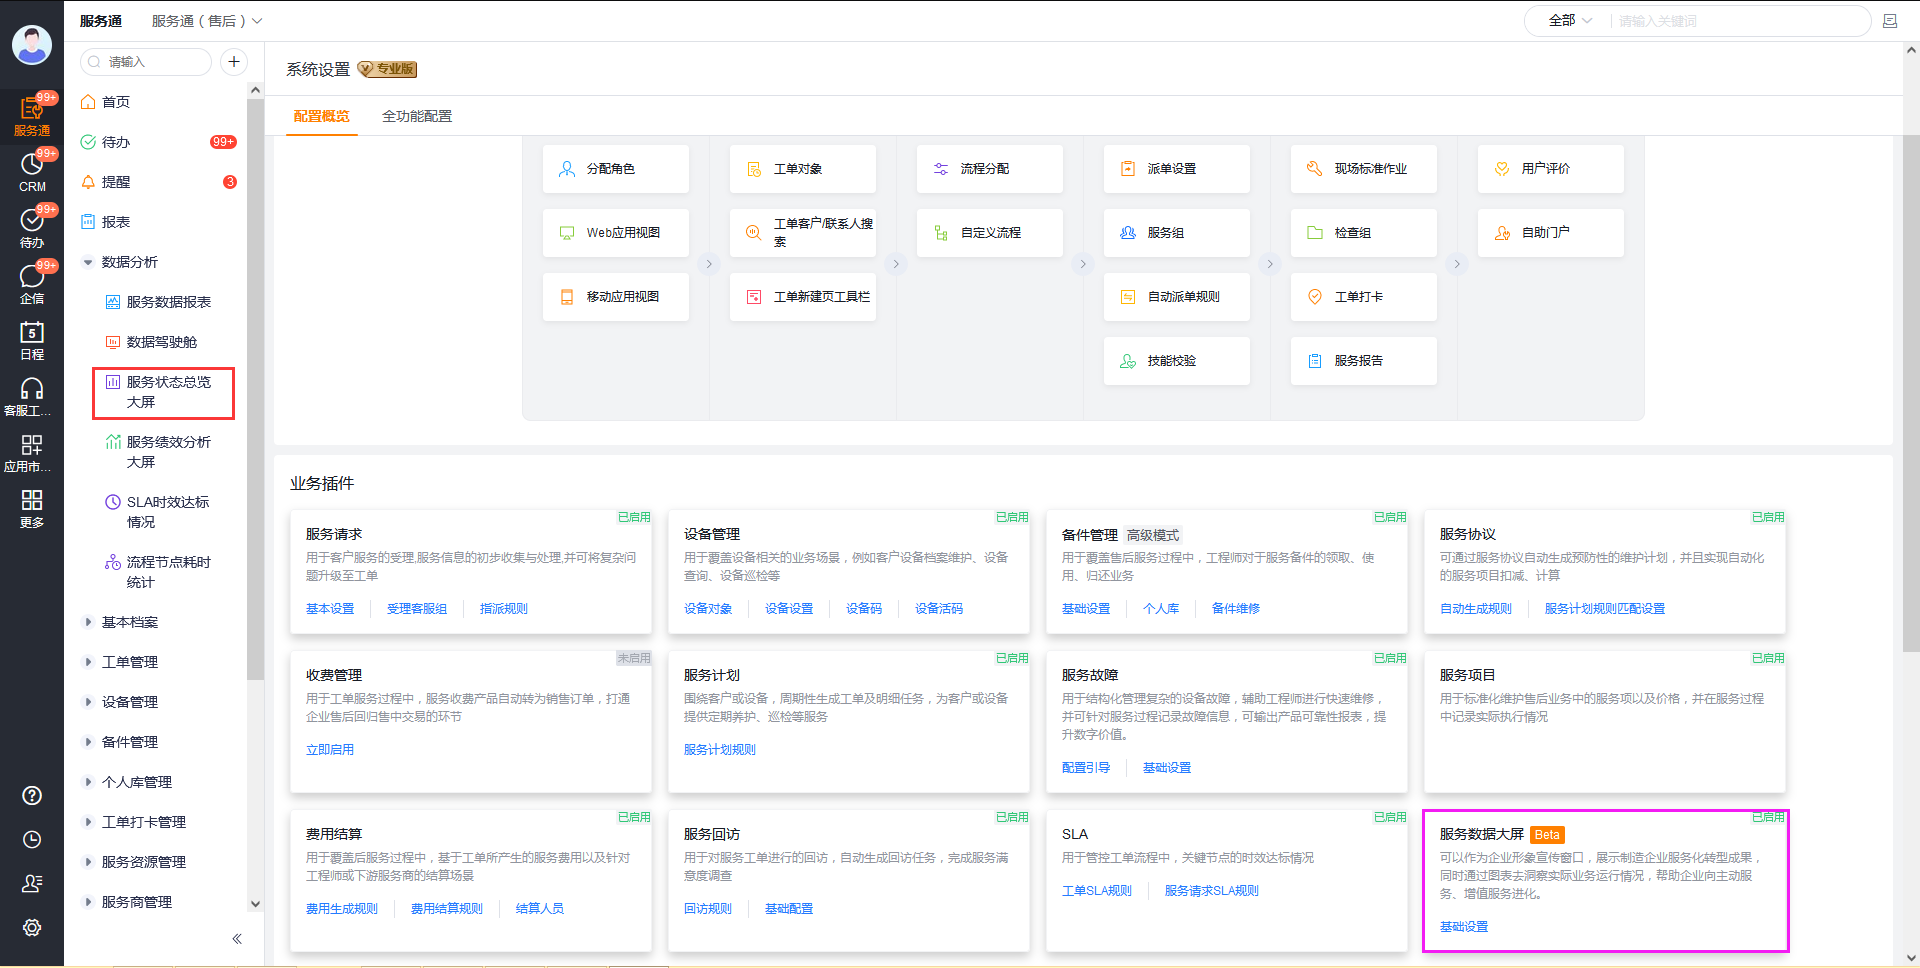
- Plugin: An administrator enabled Service Data Dashboard in Service Pass > System Settings > Business Plugins.
- Access: Your account can see Data Analysis. If it cannot, ask an administrator to check the plugin and permissions.
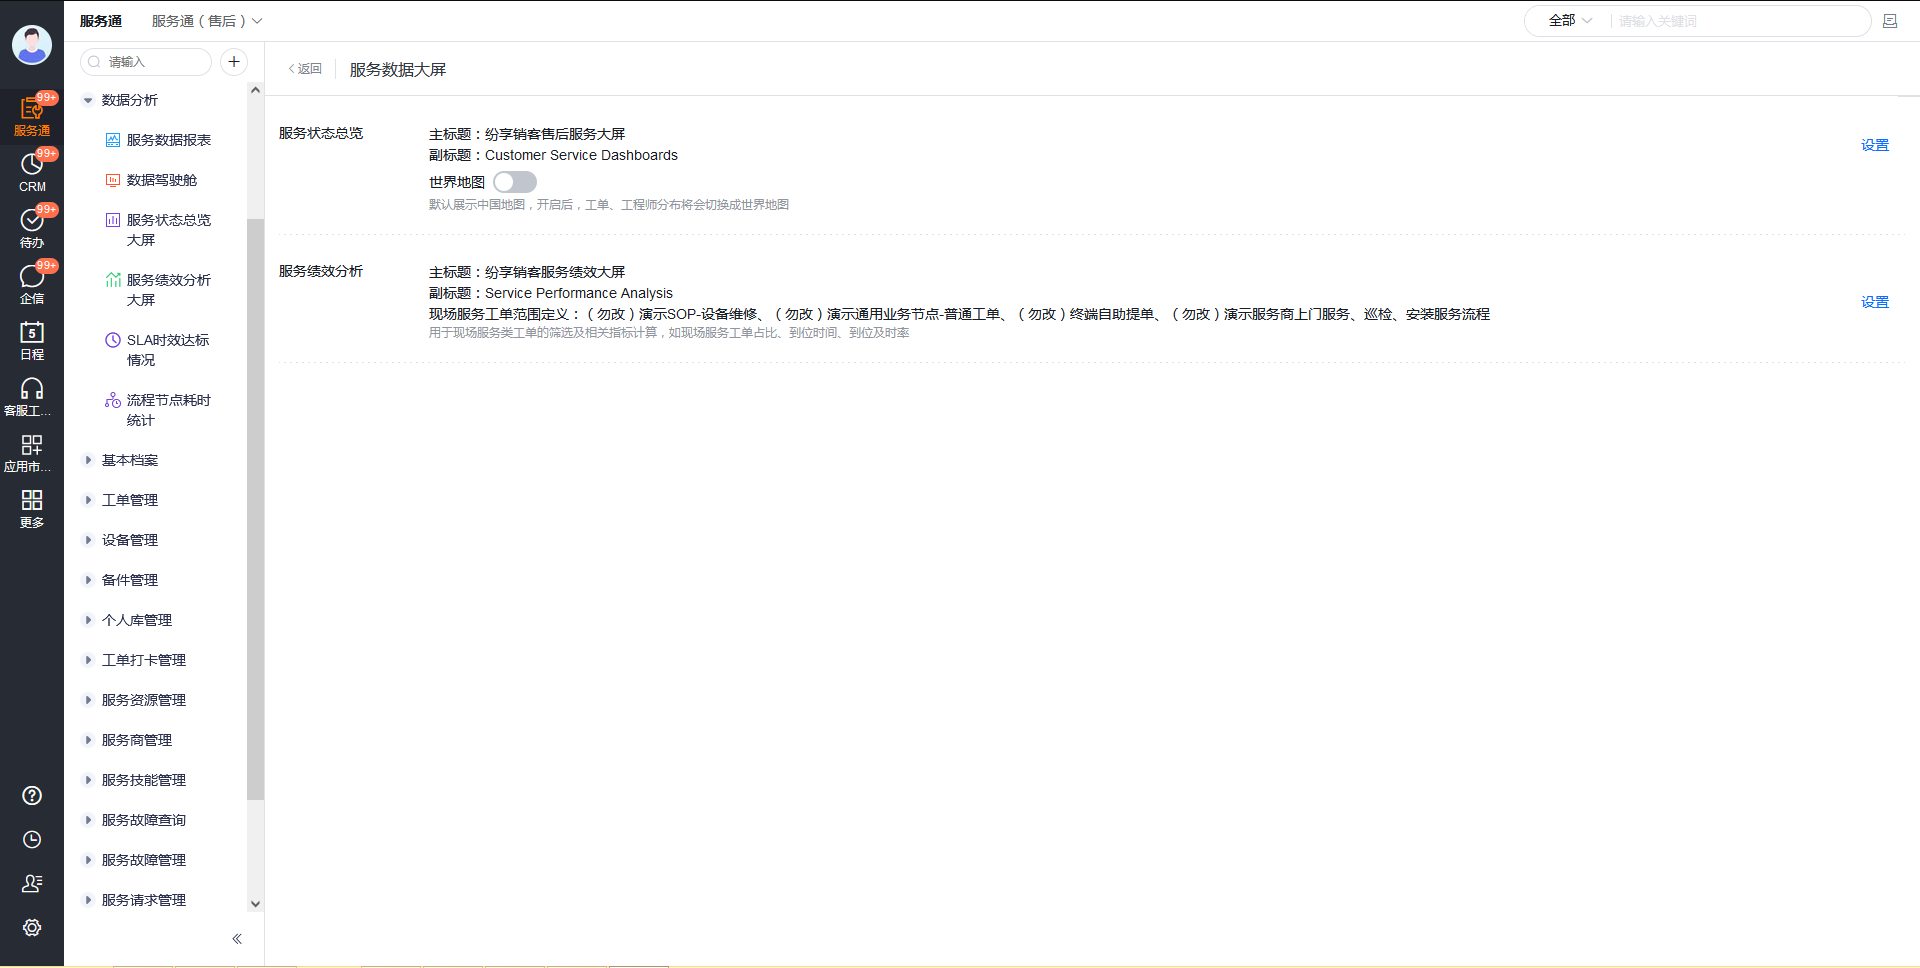
- Configuration: An administrator has set the dashboard title, subtitle, and map mode.
Operation steps
- In Service > Data Analysis, open Service Status Overview.
- Review the page title, subtitle, and map area. The map mode is controlled by the administrator in the basic settings: when World Map is turned off, the China map is displayed, and when turned on, it switches to the world map.
- Check areas such as service customers, service engineers, outsourced service providers, today's service work, and service workload trends; when you need to check specific records, check the scrolling list of the latest work orders at the bottom.
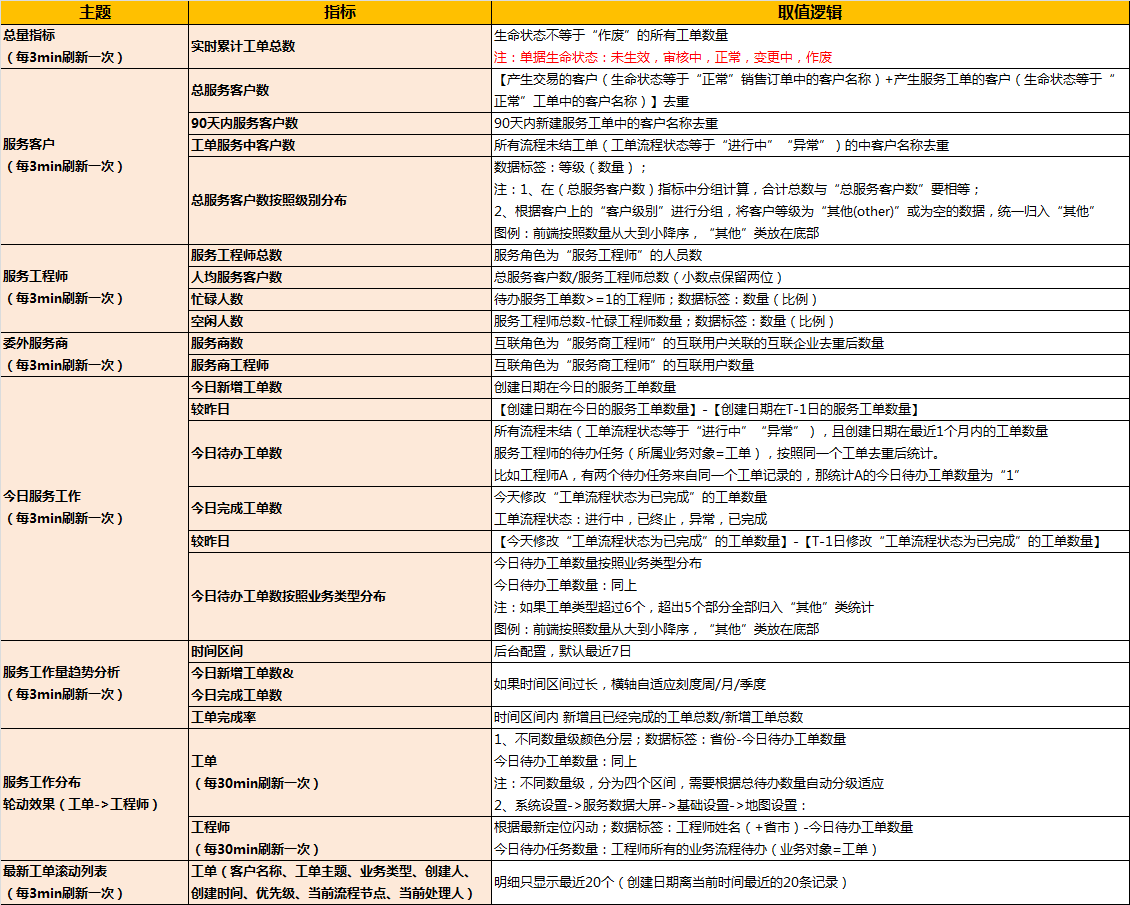
- Review the indicator definitions, then switch between work orders and engineers to compare distribution data.
Indicator definitions
| Indicator area | Definition |
|---|---|
| Real-time cumulative total number of work orders | Statistics of work orders whose life cycle status is not equal to "voided". |
| Service customers | Deduplicate by customer name; the total number of service customers includes normal customers who generate transactions or service work orders. Service customers within 90 days are calculated based on work orders with service tracking in the past 90 days. |
| Service Engineer | The total number of service engineers comes from the "Service Engineer" role; engineers with a number of pending service orders greater than or equal to 1 are included in the number of busy people, and the number of idle people is the total number minus the number of busy people. |
| Today's service work | Today's new additions are counted according to the date of creation; Today's to-dos are counted according to the work orders whose creation date is in the last month, the process has not been completed and are "in progress" or "abnormal"; today's completed work orders are counted according to the work orders modified to "completed" on the same day. |
| Service workload trend | Displays new and completed work orders according to the time range configured in the background; the completion rate is divided by the number of "new and completed" work orders within the time range divided by the number of new work orders. |
| Latest work order scrolling list | Only the 20 records with the creation date closest to the current time are displayed. |
Expected results and verification
The page displays the configured title, map mode and statistical components, based on which you can view service resource distribution, today's workload, trends and latest work orders.
Notes
- Indicators are calculated based on work order process status, customer life status, work order creation/modification time, and customer name deduplication rules; do not directly interpret page numbers as the total number of all historical records.
- Areas such as Total Metrics are refreshed every 3 minutes, and Service Work Distribution rotation is refreshed every 30 minutes; newly created or updated work orders may not appear on the page immediately.
- This dashboard does not support custom theme colors, groupings, or metrics. Use the data cockpit for custom analytics.