Appearance
View service performance
View performance metrics such as timeliness, completion time, satisfaction, revenue, engineers and spare parts for field service work orders.
Overview
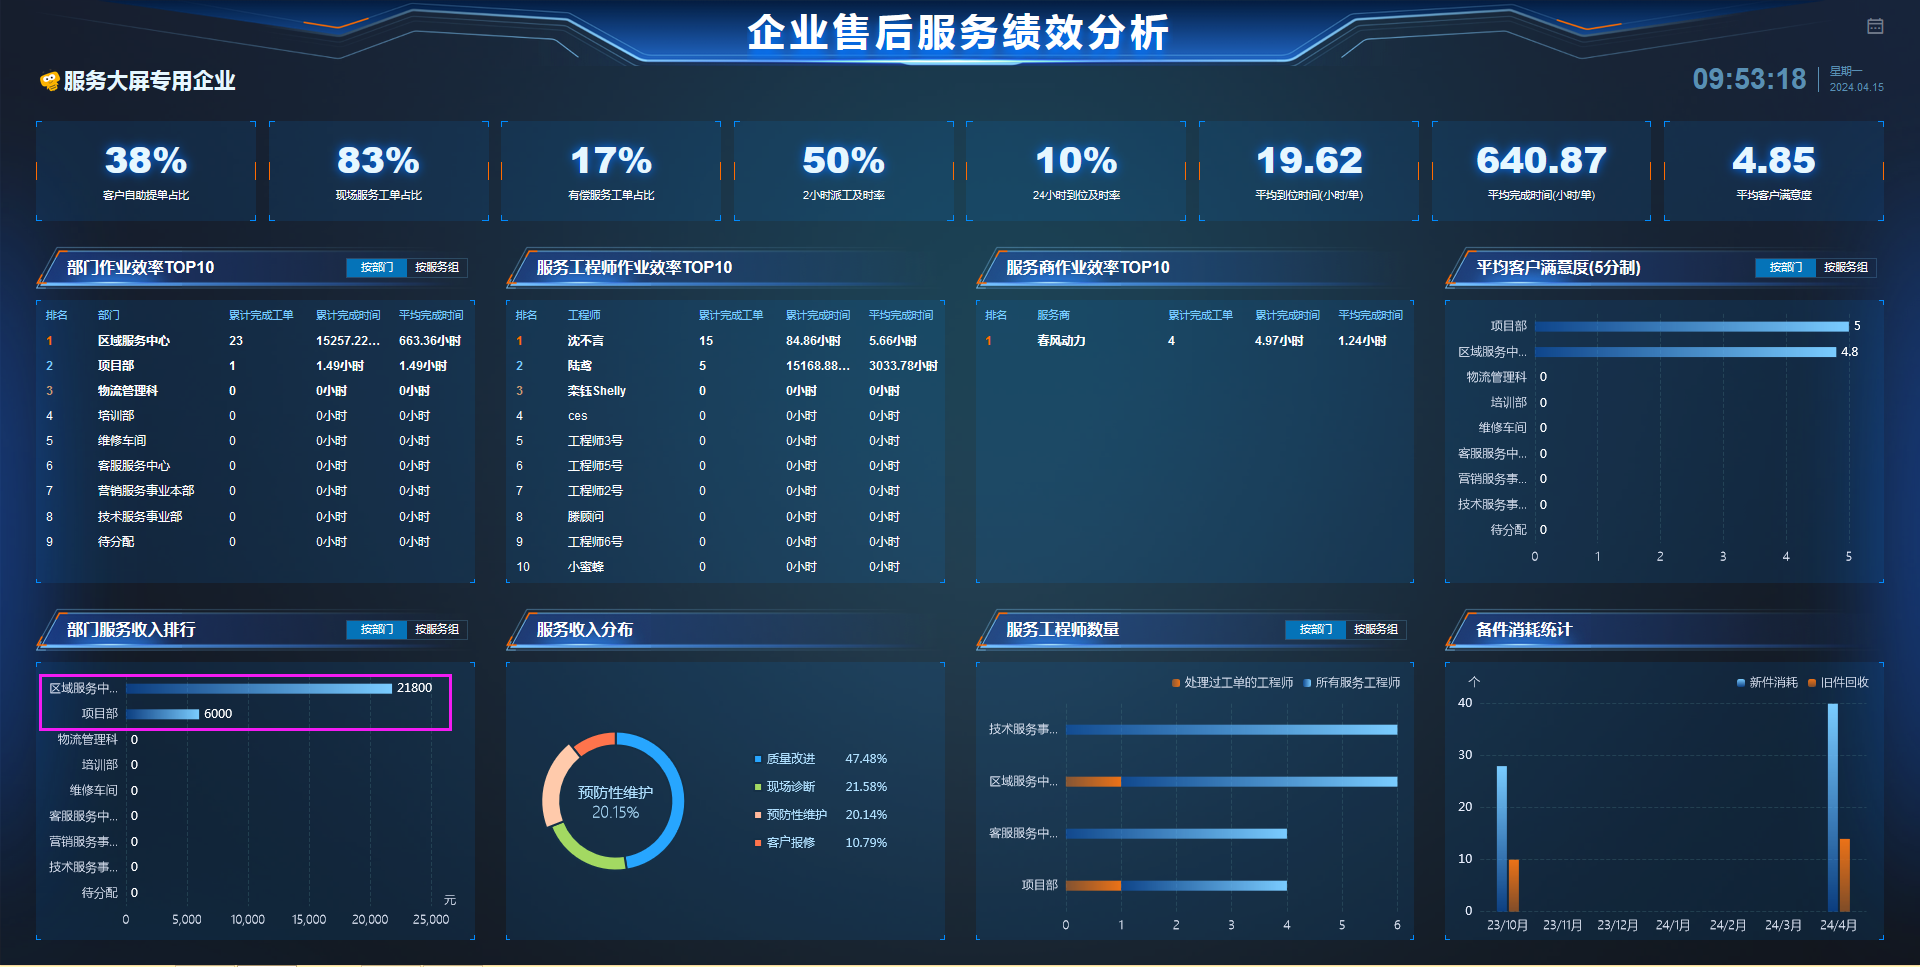
Service performance analysis is calculated based on the field service work order business type specified in the basic settings, and the results are displayed in cards, Top10 rankings, bar charts, and donut charts.
Before you begin
IMPORTANT
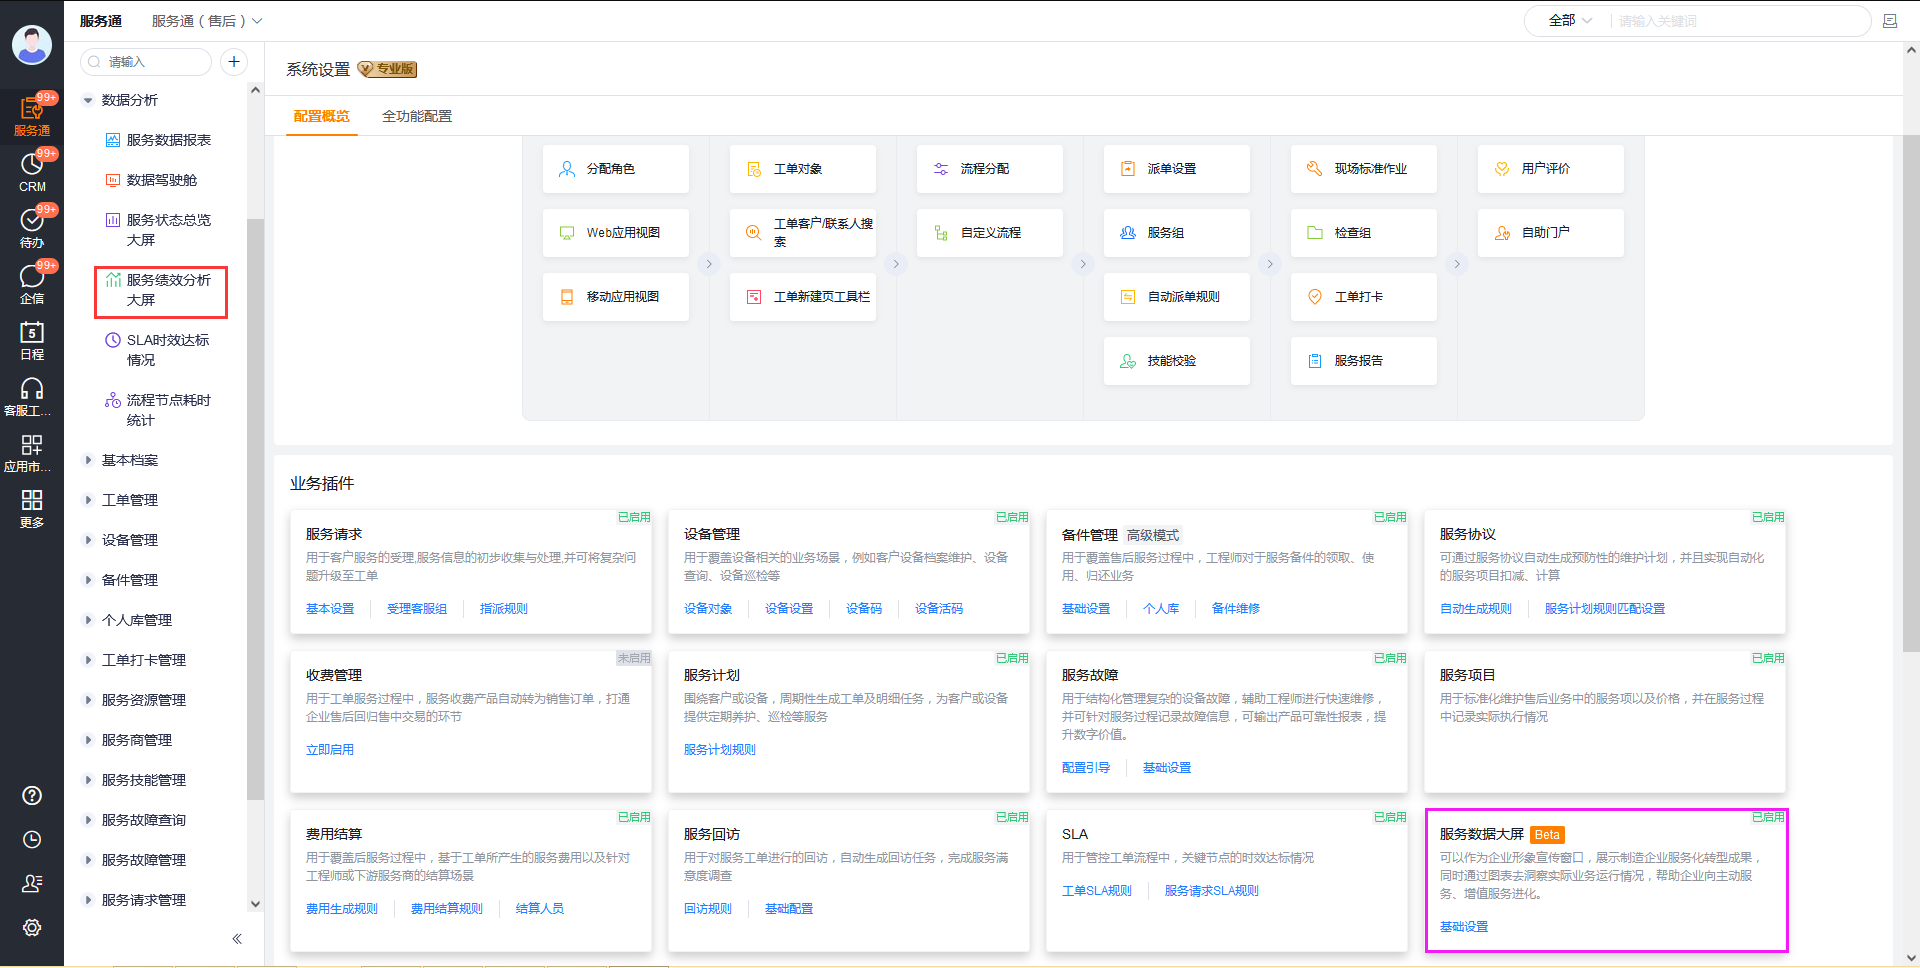
- Plugin: An administrator enabled Service Data Dashboard in Service Pass > System Settings > Business Plugins.
- Access: Your account can see Data Analysis. If it cannot, ask an administrator to check the plugin and permissions.
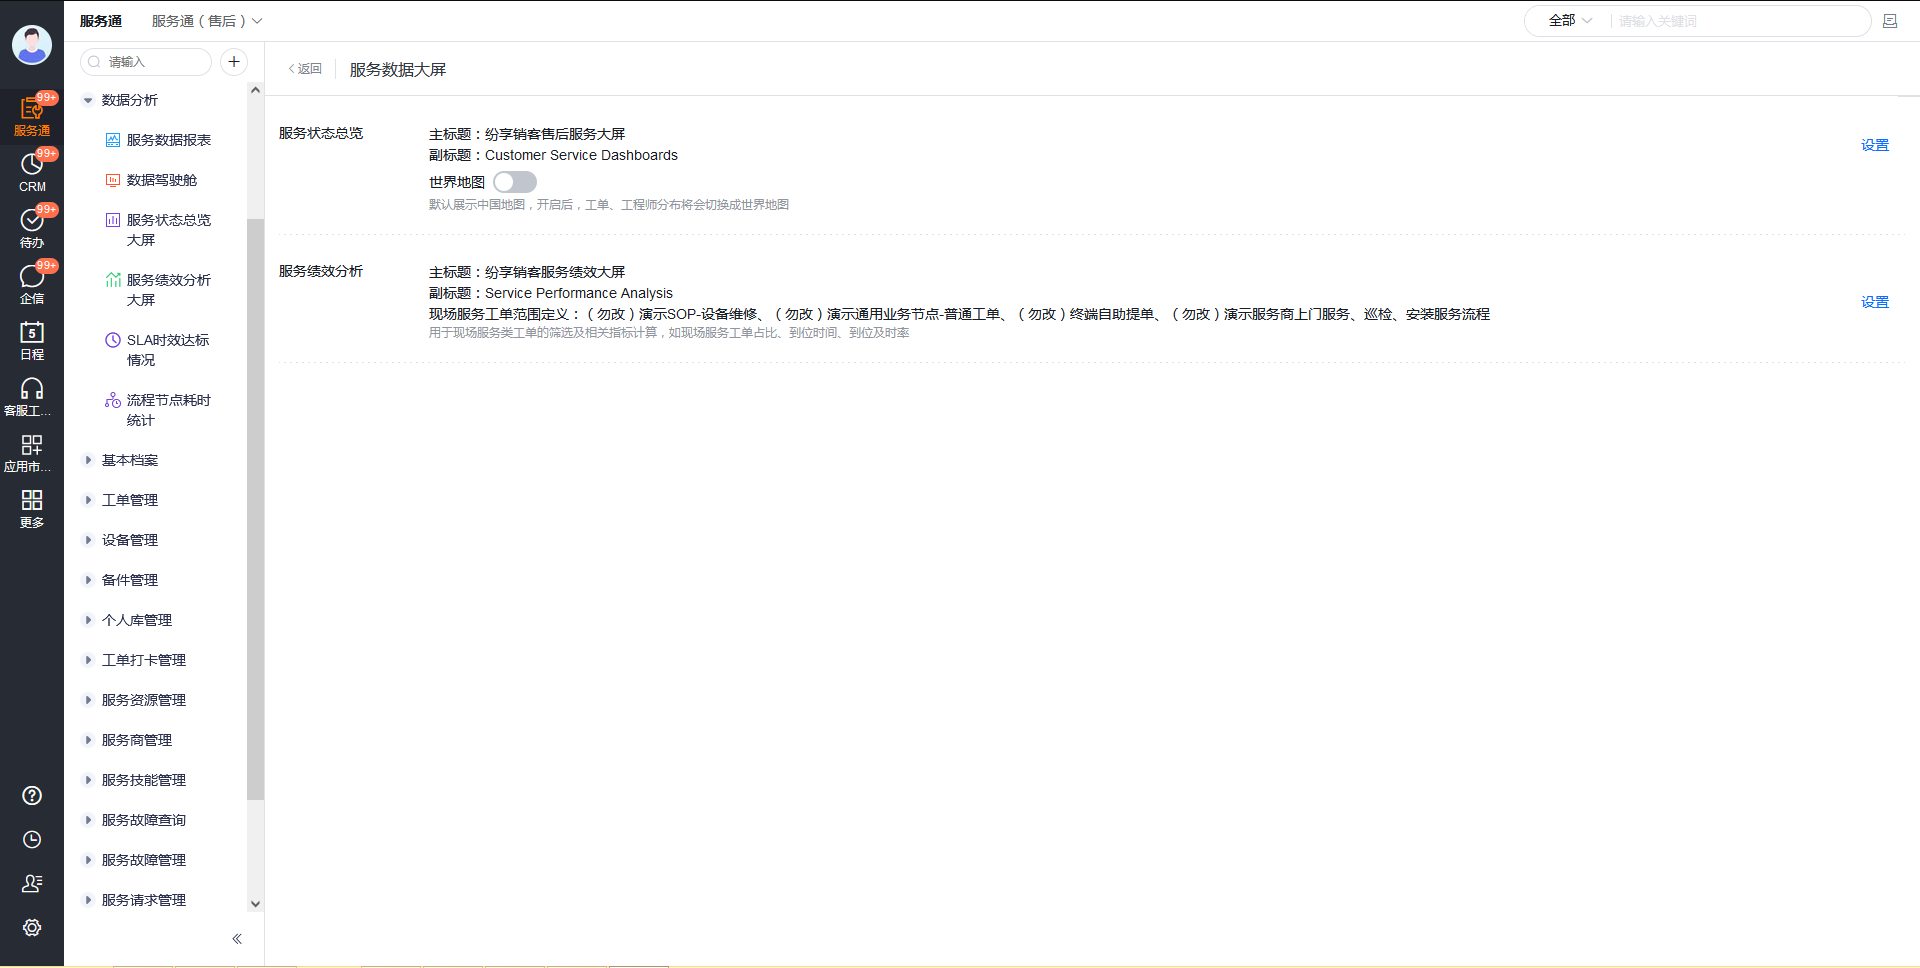
- Statistical Scope: The administrator has selected the field service work order business type in the Service Performance Analysis basic settings.
Operation steps
- In Service > Data Analysis, open Service Performance Analysis.
- Check the key performance indicators at the top and confirm that the title and statistical range of the current page are consistent with the purpose of this analysis.
- View the Top10 rankings in areas such as departments, service groups, service engineers, and service providers; when you need to compare organizations, use the "by department/by service group" switch provided by the component.
- Review customer satisfaction, service revenue, engineer count, and spare-parts consumption charts. Use the indicator definitions to interpret each value.
Indicator definitions
| Indicator group | Definition |
|---|---|
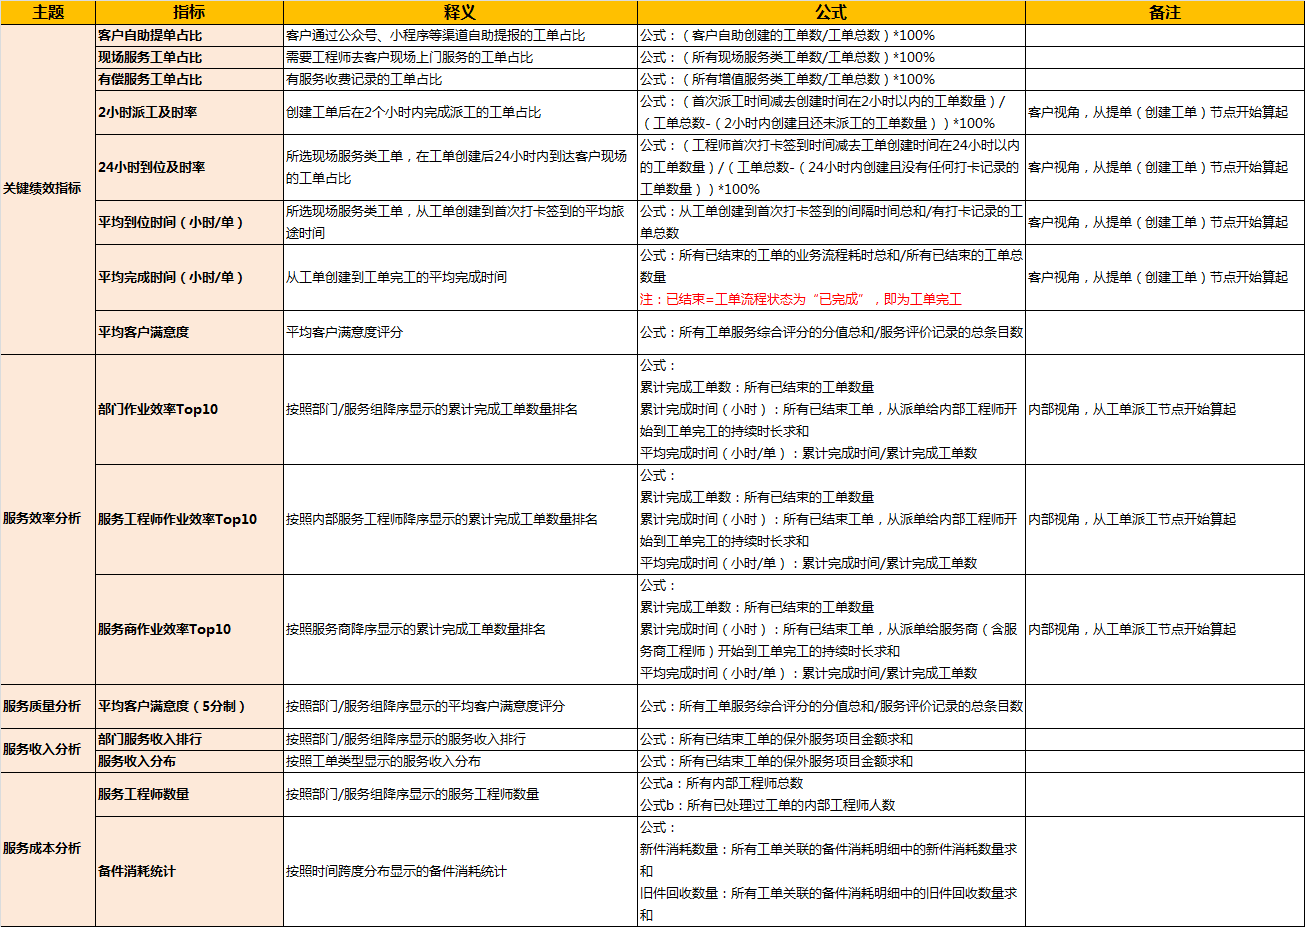
| Key Performance Indicators | The proportion of customer self-service orders, the proportion of on-site service orders, and the proportion of paid service orders are all divided by the number of work orders that meet the configuration range by the total number of work orders. The 2-hour dispatch timeliness rate and the 24-hour arrival timeliness rate are calculated based on the dispatch and first punch-in time respectively; the average arrival/completion time is calculated based on the work order time difference. |
| Service quality analysis | The average customer satisfaction is the total service evaluation score divided by the number of evaluation records; the top 10 departments, internal engineers and service providers are ranked by the cumulative number of completed work orders, and the cumulative completion time and average completion time are displayed at the same time. |
| Service income analysis | The ranking of departmental service income is based on the sum of the amount of out-of-warranty service items of completed work orders; the distribution of service income shows the amount of out-of-warranty service items by work order type. |
| Service cost analysis | The number of service engineers distinguishes all internal engineers from those who have processed work orders; spare parts consumption statistics show the consumption of new parts and recycling of old parts by time span. |
Expected results and verification
The page displays the performance indicators, rankings, and distribution charts of the selected field service work order business type, which can be used to locate timeliness, completion time, satisfaction, or cost anomalies.
Notes
- The statistical scope is determined by the work order business type configured by the administrator; after the configuration is changed, the total number and proportion viewed at different times may be different.
- The timeliness rate depends on dispatch records, engineers' first punch-in and work order completion status; when corresponding records are missing, the indicator may not be calculated as expected.
- Top 10 lists show only the highest-ranked organizations or users. Records outside the list can still have work orders. Completed work order and time-record counts affect averages.
- The source does not define one refresh interval. Use the current page values. For custom colors, groupings, or metrics, use the data cockpit.